Aim: To describe the significance of additional atherogenic risk factors in patients with elevated lipoprotein(a) (Lp(a)) and the results of a treatment at a specialized outpatient clinic with respect to outcome data.
Methods and Results: 489 patients with elevated Lp(a) levels (217.18 ± 99.60 nmol/l) who had been referred between Jan 2014 and Dec 2018 were retrospectively categorized for the presence of additional atherogenic risk factors in relation to previously occurring cardiovascular events (CVEs; 46.6 % of the total population). No relationship between levels of Lp(a) and of other lipid concentrations with CVEs at the time of referral was observed. However, in patients with CVEs an older age, male gender, hypertension, and documented atherosclerosis had a significant impact. In addition, patients who were treated for at least two years (n 163) after initial referral have been subdivided: never CVEs (n 84), CVEs only before referral (n 59), CVEs after referral (n 20). The therapeutic regimen included dietary advice, statins, ezetimibe, and PCSK9 inhibitors. In the patients with CVEs before referral only but no further events, lowdensity lipoprotein cholesterol (LDL-C) concentrations, corrected for the LDL-C content in Lp(a) particles, were optimal after 2 years (0.88 ± 0.85 mmol/l). In the other subgroups these values were higher. Percentage CVEs reduction rates were calculated that were in the same range as published for patients who were treated with lipoprotein apheresis (Pro(a)Life study).
Conclusion: The current therapeutic approaches to decrease the atherogenic risk in patients with high Lp(a) appear to be rather effective, but there remains a small number of patients in whom LDL-C concentrations are not sufficiently compensated.
Keywords: Lipoprotein(a), Cardiovascular Events; Low-Density Lipoprotein Cholesterol; Age, Hypertension; Documented Atherosclerosis
An elevation of lipoprotein(a) (Lp(a)) is an internationally recognized atherogenic risk factor which is more and more in the focus in high-risk patients who suffered from cardiovascular events (CVEs) [1,2,3,4,5,6]. Three pathophysiological mechanisms of Lp(a) have been described: 1. Promotion of atherogenesis, 2. Pro-inflammatory effects, 3. Pro-thrombotic actions [7]. Clearly, not all patients with elevated Lp(a) concentrations develop new CVEs. Thus the major attention when treating patients with Lp(a) hyperlipoproteinemia is directed at optimization of other concomitant risk factors like smoking, hypertension, diabetes,and especially increased low-density lipoprotein cholesterol (LDL-C) levels [6,8].
The purpose of this paper is to characterize patients who were seen at our specialized outpatient clinic for lipid disorders. The patients were sent to us from their family doctors, cardiologists, angiologists mainly because elevated Lp(a) concentrations had been detected.
First we analyzed whether or not additional cardiovascular risk factors besides an elevated Lp(a) level modulate the risk of CVEs that had occurred until presentation. We additionally evaluated the effectiveness of the lipid-lowering therapy (dietary advice, statins, ezetimibe, PCSK9 inhibitors) with respect to cardiovascular outcome data. Patients who were treated with LA were not considered in this evaluation. But finally we compared our outcome results with those published for LA patients in a prospective study (Pro(a)Life).
Patients who had been seen for the first time between Jan 2014 and Dec 2018 have been retrospectively analyzed. Lp(a) levels were measured using the Roche/Hitachi cobas c System LPA2®. Genetic analyses were not performed. Other lipid concentrations (total cholesterol, LDL-C (directly with Roche/ Hitachi cobas c System LDLC3®), triglycerides (TG), high-density lipoprotein cholesterol (HDL-C) were determined with usual lab methods at the first visit, after 6 months, and thereafter yearly. Non-HDL-C was calculated (total cholesterol minus HDL-C).
When measuring the LDL-C concentrations, both fractions – contained in LDL particles and in Lp(a) particles – are detected. We calculated the “corrected” LDL-C (only in LDL) using the formula: LDL-Ccorr = LDL-C – 0,3 x Lp(a) mass [9].
Moreover, Body Mass Index (BMI kg/m2), smoking behavior, hypertension (antihypertensive medication), diabetes (antidiabetic medication), chronic kidney disease (CKD; glomerular filtration rate; normal: ≥90 ml/min/1.73 m2), and a positive family history for CVEs have been taken into consideration.
Adverse cardiac or vascular events (ACVE) included all cardiovascular events, whereas major adverse coronary events (MACE) consist of an acute myocardial infarction, percutaneous coronary interventions, and/or coronary artery bypass grafting (CABG).
Usually, patients have been regularly investigated with respect to atherosclerotic lesions (plaques) with ultrasound at their carotids, aorta, and leg arteries. Findings of echocardiography and of angiographies were also documented. In 73 patients (14.9%) no image documentation was found, in 91 patients (18.6%) one vessel region was examined, in 205 patients (41.9%) two regions, 88 patients (18%) three regions, in 32 patients (6.5%) four regions.
Drugs taken by the patients, also lipid-lowering drugs (statins, ezetimibe, PCSK9 inhibitors), were continuously recorded.
All patients gave their written informed consent to this evaluation which had been approved by the local ethics committee (EK 3222082014).
The statistical analysis was performed using SPSS for Windows, version 24.0 (SPSS Inc., U.S.A.). Metrical variables are given as mean values and standard deviations (sd) or ranges, respectively. In a Kolmogorov-Smirnov testing the studied variables did not show a normal distribution. Therefore for comparisons of continuous variables non-parametric tests have been applied. The Mann-Whitney Test was used to compare two independent variables, and for more than two variables the Kruskal-Wallis test was used. Categorical variables have been evaluated with the ChiSquare Test. A p-value < 0.05 was considered to be significant. In order to analyze the association of an independent variable with dependent variables a binary logistic regression analysis has been performed.
This study consists of two parts: 1. Analysis of lipid parameters and other risk factors in all patients (n 489) subdividing them according to the presence or absence of CVEs in their history at the time of first presentation, 2. Patients (n 163) with a follow-up time of at least 2 years at our department; three subgroups have been defined: no: no CVEs (neither before nor during follow-up; no ACVE n 84; no MACE n 111), pre: CVEs only before follow-up (ACVE n 59; MACE n 37), post: CVEs during follow-up (ACVE n 20; MACE n 15); LDL-C and LDL-Ccorr have been reported at the start and the end of the follow-up.
The total number of patients was 489 (236 males, 253 females, mean age 56 years (range: 30 – 75 years); Lp(a)) levels (217.18 ± 99.60 nmol/l).
219 patients were on a statin when seen at our department for the first time; the majority of these patients had suffered from CVEs. Another 186 patients were started with a statin thereafter, atorvastatin has been used preferentially. In 73 patients PCSK9 inhibitor injections were initiated by the physicians of our department.
Before the patients were referred to our department, 334 CVEs had occurred (MI 2.7 %, PCI 40.4%, CABG 10.8%, stroke 15%, peripheral arterial PTA/stent/bypass 18.9%, angina pectoris 0.3%, atrial fibrillation 3.3%, pacemaker / implantable cardioverter defibrillator (PM/ICD) 0.9%, TIA 4.8%, carotis PTA/stent 3%). 150 patients (30.7%) showed one CVE, 32 patients (6.5%) 2 CVEs, 26 patients (5.3%) 3 CVEs, 8 patients (1.6%) 4 CVEs, 5 patients (1.0%) 5 CVEs, 4 patients (0.8%) 6 CVEs, 1 patient (0.2%) 7 CVEs. 261 patients (53.4 %) were free of any CVEs.
The first step in this analysis was to compare the data of patients who had suffered from CVEs prior to their first visit at our department with those who did not.
The major basic findings of this comparison are given in Table 1.
Whereas Lp(a) concentrations did not differ between subjects with and without ACVE and with and without MACE, patients with ACVE compared to without ACVE were significantly older, more predominately were male, more often were smokers, and more often were hypertensive, diabetic or had CKD. The same differences could be found for patients with MACE compared to patients without MACE.
Table 1: Comparison of age, gender distribution, smoking habits, frequency of hypertension, diabetes mellitus, chronic kidney disease, and lipid parameters of patients without and with ACVE and MACE in their history.
Subgroup |
ACVE no |
ACVE yes |
MACE no |
MACE yes |
n (%) |
261 (53.4 %) |
228 (44.6 %) |
347 (71 %) |
142 (29 %) |
Age (years; mean, range) |
49.2 (18 – 79) |
58.6 (20 – 82)a |
50.8 (18 – 82) |
60.4 (34 – 82)b |
Gender (males/females; n, %) |
95 (36.4 %)/166 (63.6 %) |
141 (61.8 %)/87 (38.2 %)a |
136 (39.2 %)/211 (60.8 %) |
100 (70.4 %)/42 (29.6 %)b |
BMI (kg/m2; mean, sd) |
26.4 (5.0) |
26.8 (4.6) |
26.4 (5.1) |
27.1 (4.0)c |
Smoker (never, yes; n, %) |
185 (70.9 %)/76 (29.1 %) |
122 (53.5 %)/106 (46.6 %)a |
230 (66.3 %)/117 (33.7 %) |
77 (54.2 %)/65 (45.8 %)c |
Hypertension (no, yes; n, %) |
161 (61.7 %)/100 (38.3 %) |
33 (14.5 %)/195 (85.5 %)a |
190 (54.8 %)/157 (45.2 %) |
4 (39.7 %)/138 (97.2 %)a |
DM Type II (no, yes; n, %) |
244 (93.5 %)/17 (6.5 %) |
187 (82 %)/41 (18 %)a |
311 (89.6 %)/36 (10.4 %) |
120 (84.5 %)/22 (15.5 %) |
CKD (no, yes; n, %) |
140 (54.3 %)/118 (45.7 %) |
90 (40 %)/135 (60 %)a |
181 (52.9 %)/161 (47.1 %) |
49 (34.8 %)/92 (65.2 %)b |
Lp(a) (nmol/l; mean, sd) |
215.81 (100.25) |
218.74 (99.05) |
214.69 (108.98) |
224.69 (109.98) |
LDL-C (mmol/l; mean, sd) |
4.09 (1.56) |
3.41 (1.57)a |
3.97 (1.60) |
3.29 (1.47)b |
LDL-Ccorr (mmol/l; mean, sd) |
3.29 (1.63) |
2.58 (1.55)a |
3.17 (1.65) |
2.44 (1.43)b |
HDL-C (mmol/l; mean, sd) |
1.63 (0.54) |
1.47 (0.46)a |
1.61 (0.53) |
1.43 (0.45)b |
Non-HDL-C (mmol/l; mean, sd) |
3.87 (1.75) |
3.07 (1.75)a |
3.73 (1.79) |
2.94 (1.68)b |
a: p < 0.01 when comparing with ACVE no, b: p < 0.01 when comparing with MACE no, c: p < 0.05 when comparing with MACE no |
||||
LDL-C, LDL-Ccorr, and HDL-C levels were lower in patients with previous ACVE compared to those without. TG concentrations did not differ between the subgroups (not given).
The majority of patients with CKD only showed a mild impairment of renal function. In the subgroups with CVEs the percentage of patients with a GFR < 60 ml/min/1.73 m2 was significantly higher (ACVE yes: 12.9%, MACE yes 14.1%) than in the subgroups with no CVEs (ACVE no 7.5%, MACE no 4.7%).
Percentages of patients with documented atherosclerosis were different between the subgroups (Table 2).
The logistic regression analysis for ACVE showed the following significant odds ratios (OR): age beyond 60 years (OR 1.925; 95 % CI 1.035 – 3.579; p 0.038), male gender (OR 1.835; 95 % CI 1.070 – 3.150; p 0.028), hypertension (OR 4.884; 95 % CI 2.728 – 8.845; p 0.000), documented atherosclerosis (OR 8.066; 95 % CI 4.353 – 14.9047; p 0.000). Smoking status, obesity, diabetes, CKD, and lipid concentrations had no significant influence.
Table 2: Documented atherosclerosis in patients without and with ACVE and MACE.
Subgroup |
ACVE no |
ACVE yes |
MACE no |
MACE yes |
n (no/yes; %) |
157 (60.2 %)/104 (39.8 %) |
25 (11 %)/203 (89 %)a |
180 (51.9 %)/167 (48.1 %) |
0 (0 %)/142 (100 %)b |
a: p = 0.000 versus ACVE no, b: p = 0.000 versus MACE no |
||||
Table 3: Comparison of age, gender distribution, hypertension, and atherosckerosis in the ACVE subgroups no, pre, and post in patients who were seen at least for 2 years (significant differences).
Subgroup |
ACVE no |
ACVE pre |
ACVE post |
Age (years; mean, range) |
50.24 (18 – 76) |
59.49 (30 – 82)a |
59.75 (40 – 79)b |
Gender (m, f; n, %) |
29 (34.5 %)/55 (65.5 %) |
37 (62.7 %)/22 (37.3 %)a |
14 (70 %)/6 (30 %)b |
Hypertension (no, yes; n, %) |
49 (58.3 %)/35 (41.7 %) |
10 (16.9 %)/49 (83.1 %)a |
1 (5 %)/19 (95 %)a |
Atherosclerosis (no, yes; n, %) |
37 (44 %)/47 (56 %) |
8 (13.6 %)/51 (86.4 %)a |
0/20 (100 %)a |
a: p < 0.01 versus ACVE no, b: p < 0.05 versus ACVE no |
|||
The analogous analysis for MACE yielded the following significant results: male gender (OR 3.198; 95 % CI 1.719 – 5.949; p 0.000), hypertension (OR 26.821; 59 % CI 7.644 – 94.110; p 0.000), documented atherosclerosis (OR 76.794; 95 % CI 10.108 – 583.420; p 0.000).
Among the 489 patients followed-up only 37 developed a new CVE (12 patients as a first event) when treated at our specialized department. The observation time varied between 0 and 60 months.
In addition, patients with a follow-up time of at least 2 years at our department were analyzed (n 163). The definition of three subgroups has been given in the methods section.
In Table 3 data are shown for these subgroups for ACVE - findings for MACE subgroups were similar (not given).
Patients who developed new ACVE during follow-up (ACVE post) were more often male, more often hypertensive and always show atherosclerosis on imaging. No significant differences between the ACVE subgroups were observed for BMI, for family history with respect to early CVEs, for smoking history, diabetes mellitus Type II, CKD.
Table 4: Event rates per patient and year – comparison between two years anteceding and two years during the observation time.
(Year -2 and Year -1) |
(Year +1 and Year +2) |
Change (%) |
p value |
|
ACVE |
0.36 (0.63) |
0.10 (0.38) |
-72.2 |
0 |
MACE |
0.22 (0.53) |
0.07 (0.28) |
-68.2 |
0.001 |
Lp(a) levels (in nmol/l; mean, sd) at the start of the treatment period were not statistically different between these subgroups (ACVE no: 217.25 (118.86); ACVE pre 212.46 (95.99); ACVE post 205.78 (58.85). During two years, no change of these mean levels was observed.
The course of LDLC and LDL-Ccorr concentrations after two years observation time is given in Figures 1 and 2.
When comparing with the initial data, LDL-C levels were reduced in all three subgroups: ACVE no -25.43 %, ACVE pre -31.86%, ACVE post -35.17%.
It is interesting to notice that reductions of LDL-Ccorr levels were more expressed: ACVE no -30.28%, ACVE pre -64.37, ACVE post -30.55%, especially in subgroup ACVE pre.
Non-HDL-C concentrations were decreased similarly: ACVE no -34.72%, ACVE pre -60.21%, ACVE post -35.03%.
HDL-C levels (in mmol/l; mean, sd) remained unchanged in subgroups ACVE no and ACVE pre, but significantly increased in ACVE post (from 1.33 (0.38) to 1.50 (0.61); p 0.025).
TG concentrations (in mmol/l; mean, sd) were slightly elevated at the start (ACVE no 2.69 (4.80), ACVE pre 2.32 (3.98); ACVE post 1.94 (1.04). After 6 months, in all subgroups TG levels were significantly lower (all patients were given dietary advice), but after 2 years only in the ACVE pre patients this significance was still seen (ACVE pre after 2 years 1.40 (0.98) mmol/l).
More than 85 % of the patients in these subgroups were treated with a statin (difference is not significant). Most often atorvastatin was administered. In the ACVE pre subgroup, 23.7 % tolerated the maximal statin dose, whereas in the ACVE post subgroup this was the case in only 10 %.
Ezetimibe was used in 52.4 % of the patients of the ACVE no, in 62.7 % of the ACVE pre, and in 75 % of the ACVE post subgroups.
During the observation period, a PCSK9 inhibitor therapy was initiated in 33 patients: in 7.1 % of the ACVE no, in 28.8 % of the ACVE pre and in 50 % of the ACVE post subgroups. In the latter subgroup, this injection therapy was usually started following a CVE. When comparing the data at the start with those after two years, the PCSK9 inhibitors reduced Lp(a) by 4.65 %, LDL-C by 41.86 %, and LDL-Ccorr by 54.62 %.
CVE rates were clearly decreased as shown in a comparison of the time periods two years before the start of the treatment at our department and the two years of the observation time (Table 4). This evaluation approach has been published for event rates observed in patients who were treated with lipoprotein apheresis.
In our study population in patients with elevated Lp(a) levels no relationship between the magnitude of Lp(a) level elevation and the incidence of CVEs was observed. This is in contrast to data published in the literature and to a former publication from our group where we had described the situation of patients who were also treated at our outpatient department [10]. One major difference between these two publications is that presently patients who were sent to the apheresis unit were excluded. But even in apheresis patients no relationship between the occurrence of CVEs under extracorporeal therapy and Lp(a) levels was observed [11]. One might speculate that in patients with elevated Lp(a) levels above a certain threshold concentration, which has not been determined so far, further increases in Lp(a) levels do not lead to an additional increased risk of CVE, but additional risk factors may become more important in modulating the additional risk. Moreover, for such a cross-sectional study a selection bias may play a role – patients with an extremely high atherogenic risk surely have died.
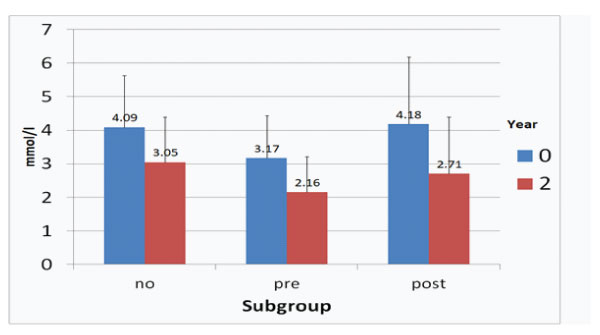
Figure 1: LDL-C concentrations at start and after two years in the ACVE subgroups (no: no CVEs, pre: CVEs prior to follow-up, post: CVEs during follow-up).
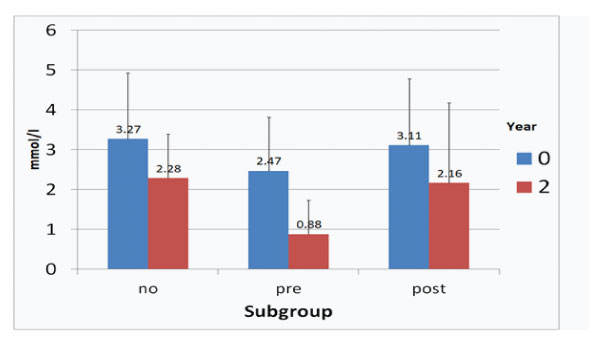
Figure 2: LDL-Ccorr concentrations at start and after two years in the ACVE subgroups (no: no CVEs, pre: CVEs prior to follow-up, post: CVEs during follow-up).
Lp(a) levels (in nmol/l, mean, sd) in our patients were rather high (217.18 (99.60)) and 46.6% of the patients suffered from CVEs. Considering this high background risk [6] we observed that additional atherogenic risk factors such as older age, male gender, hypertension, and documented atherosclerosis play a more important role than further increases in Lp(a) levels. Especially the documentation of manifest arteriosclerosis by imaging modalities, whether clinically apparent or not, seems to be a risk modifier. This fact, which has been discussed in the literature [4], should be taken into consideration when caring for patients with high Lp(a) concentrations.
Other risk factors like obesity, a positive family history for early CVEs, smoking history, diabetes mellitus Type II, CKD did not exert a statistically significant effect – of course, in single cases they may be important.
In another recently published paper, older age, male sex, hypertension, smoking, and an Lp(a)≥30 mg/dl were found to significantly contribute to stenotic atherosclerosis [2]. In contrast to our patients, in the Russian cohort patients with normal Lp(a) concentrations (< 30 mg/dl) were also included.
In the EPIC-Norfolk study a cardiovascular health score (consisting of BMI, healthy diet score, physical activity, smoking status, blood pressure, total cholesterol, and diabetes mellitus) has been calculated [12]. The results show that among patients with high Lp(a), those with ideal cardiovascular health have a relative risk of cardiovascular disease (CVE) of 0.33 (95% CI, 0.170.63, p < 0.001) compared to those with poor cardiovascular health. Interestingly, no evidence that the relationship between health categories and CVD risk is affected by Lp(a) levels (or genotype) was described. This finding is in agreement with our data. The authors suggest that if specific Lp(a)-lowering therapies should become available, these should be added on top of lifestyle management and on top of other agents that target risk factors for CVD such as LDL-C and blood pressure in people who cannot manage these risk factors with lifestyle alone [12].
Up to now, two effective therapeutic approaches to lower Lp(a) are used: 1. Lipoprotein apheresis (LA) – with impressive results with respect to the reduction of new CVEs [13,14], 2. PCSK9 inhibitors (not effective in all patients) – with a modest effect on outcome data [15,16] – the use of PCSK9 inhibitors is not accepted as an official indication to decrease Lp(a). At present, in the HORIZON study pelacarsen, an antisense oligonucleotide against apolipoprotein(a) [17], is being tested (HORIZON trial; ClinicalTrials.gov Identifier: NCT04023552-TQJ230). For all these therapeutic options, an opitimization of other atherogenic risk factors is required.
Patients with CVEs in their history more often were treated with statins – this explains lower LDL-C values at their first visit at our Lipid Clinic. Evidently, the presence of atherosclerotic lesions only without clinical manifestations did not induce physicians to start a statin therapy. But it has to be emphasized that LDL-C concentrations were higher than those recommended in recent international guidelines for high-risk patients [4].
Table 5: Comparison of our outpatients with patients who were treated with LA in the Pro(a)Life study [18] (in both studies data for two years before the treatment started and during 2 years during intervention are reported).
Study population |
Outpatients (this study) |
LA patients (Pro(a)Life study) |
Number (% males) |
163 (49.1 %) |
166 (72.3 %) |
Mean age at start of therapy (years) |
56.5 |
56.5 |
Mean Lp(a) (nmol/l) at start of therapy |
211.83 |
~252 |
Mean LDL-C (mmol/l) at start of therapy |
3.81 |
2.57 |
Mean ACVE rates before start |
0.36 |
0.61 |
Mean ACVE rates during therapy (reduction in %) |
0.10 (-72.2 %) |
0.14 (-75.9 %) |
Mean MACE rates before start |
0.22 |
0.41 |
Mean MACE rates during therapy (reduction in %) |
0.07 (-68.2 %) |
0.09 (-78.0 %) |
We compare the situation in our patients with those who were treated with LA in the Pro(a)Life study with an identical observation time (Table 5) [18].
Looking at the two years before the patients were referred to our Lipid Clinic, the annual rates of ACVE and of MACE per patient were clearly lower than in the LA patients of the Pro(a)Life study. Lp(a) levels were lower in our patients, but LDL-C levels were higher. Reduction rates of both ACVE and of MACE were in the same range in the two cohorts. In other words, the non-invasive therapy is an essential part of the cardiovascular efficiency in LA patients.
In a follow-up publication of the Pro(a)Life study it was reported that low incidence rates of CVEs during the extracorporeal therapy remained stable up to 5 years [19].
The 2019 ESC/EAS guideline recommends to decrease to LDL-C < 1.4 mmol/l in very high-risk patients [4]. In our ACVE pre subgroup this target was reached only when taking the LDL-Ccorr levels into account. Though it has to be taken into consideration that in this guideline an elevation of Lp(a) is not listed in the classification table of risk categories, but it is recommended that Lp(a) should be measured at least once in each adult person´s lifetime.
Patients with no CVEs in their history and elevated Lp(a) concentrations may perhaps be classified as having a moderate atherosclerotic risk – when accepting this consideration then the achieved LDL-Ccorr level in the ACVE no subgroup may be regarded to be at target (lower than 2.6 mmol/l).
In contrast, in patients who developed new CVEs (subgroup ACVE post) the reached LDL-C concentrations remained above the needed target. These patients did not tolerate statins so well (lower number of patients on maximal statin dose), were treated more often with ezetimibe and even with PCSK9 inhibitors. The latter were typically started when a CVE had occurred. This subgroup needs new therapeutic approaches in the future.
Of course, it has to be taken into consideration that all patients were given an advice with respect to a healthy lifestyle (especially regarding non-smoking, nutrition, physical activity).
This study has the following limitations: 1. Patients included into this study had been sent to our outpatient department because of established elevation of Lp(a) – thus our cohort may be not representative for the general German population; 2. An ultrasound investigation was not performed in all patients, not all vessel regions have been studied. In the last years, we tried to improve this situation; 3. The observation time of 2 years is rather short – but this was also the case in randomized studies with PCSK9 inhibitors and in the first publication of the Pro(a)Life study; 4. In this real-world study, only parameters which have been routinely assessed have been taken into consideration. Other factors, like indicators of inflammation, may have contributed to the atherogenicity.
In summary, it can be stated that an optimization of LDL-C concentrations in patients with high Lp(a) levels appears to be a rather effective therapeutic approach to improve the increased atherosclerotic risk. Patients with no optimal result with respect to reaching the LDL-C target are at a higher risk to develop new CVEs, but this is only a small number of patients.
Our data show that an elevation of Lp(a) level per se does not mean that CVEs will develop in a given patient. Additional atherogenic risk factors, like old age, male gender, hypertension, an elevated LDL-C concentration will essentially contribute to this risk. A healthy lifestyle will be required in each affected person.
The current therapeutic approaches to decrease the atherogenic risk in patients with high Lp(a) appear to be rather effective, but there remains a small number of patients in whom LDL-C concentrations are not sufficiently compensated.
Conflicts of interest
UJ: honoraria from Akcea, Amgen, Sanofi-Aventis, Kaneka, Fresenius Medical; Care, Novartis; KW: nothing to declare; ST: honoraria for lectures and consulting by Amgen, Fresenius Medical Care, Kaneka, MSD, Sanofi-Aventis; US: No conflicts of interest relevant to this publication; NW: honoraria for lectures by Amgen, Novartis, Sanofi; SF: No conflicts of interest relevant to this publication.