Lung status during pulmonary embolism and patient follow-up, should be evaluated and the accurate estimation of lungs volume is important; By 3-dimensional (3D) medical imaging data and diagnosis of patient embolism become much more reliable.
A method for lungs’ volume determination by Tc99m SPECT images and the definition of an Index of Lung Perfusion homogeneity (LPI) is demonstrated. Volumes of reconstructed transverse slices were estimated by counting the voxels inside each slice of SPECT data of the lung perfusions studies. For the lung lobe’s edge and the background subtraction, an edge detection algorithm was produced. The total lung lobe volume was derived by summing the 2D SPECT slices’ volumes. Non-uniform attenuation compensation was performed by quantitative filtered back-projection. A lung lobe segment volume analysis was also determined for the identification of lung section volumes with diminished radionuclide concentration. A follow-up correlation of the 3D SPECT of each lung perfusion tomography was studied by Lung Shaded surface display and Volume Rendering in 3D image post-processing.
Lung Perfusion Index (LPI) is the ratio of lung segment volume over the whole organ volume and indicates the grade of the lung section perfusion situation. In follow-up patient studies, comparison of Lung Perfusion Index (LPI) in the repeat scans constitutes the Pulmonary Improvement Factor (PIF).
In order to evaluate the accuracy of these measurements, 5 cylindrical phantoms, [1000-1500] ml volume, containing Tc99m activity dispersed in an imitation lung tissue (a mixture of styrofoam beds with water) were acquired under conditions similar to those of the patients’ study. Using the regression equation derived from the phantom study, the accuracy of the volumes of the lungs’ lobes was calculated.
The method is simple and fast with a relative error of up to 3% for length, 11% for the area and 8% for volume determinations. The precision of the estimation varied, depending on the size and clinical status of the lung lobe.
This method has been developed to assist in the accurate interpretation of 3D SPECT perfusion lung imaging by volume and semiquantitative lung perfusion index determination.
Keywords:
3D SPECT Data, Lung Volume Rendering, Lung Surface Volume, Lung Perfusion Index, Image Processing
Radionuclide perfusion scintigraphy remains an important diagnostic tool, not only in the diagnosis of perfusion emboli as an emergency tool but also in the assessment of regional function in a follow-up procedure. The main strength of the perfusion scan and its image processing in 3D rendering volume is that it allows us to obtain quantitative information about the perfusion of the lungs in a physiological way.
Lung perfusion scintigraphy has been used as a diagnostic method for various pulmonary diseases. Specifically, it has been used for assessment of Pulmonary Embolus (PE) in a patient with or without the presence of chronic obstructive pulmonary disease and as part of routine follow-up evaluation of lung therapy for assessment of pulmonary emboli in patients with or without the presence of chronic obstructive pulmonary disease.
Pulmonary embolism is a relatively common and potentially fatal disease. The incidence of deep venous thrombosis is approximately one in 1000 per year and about 50% of deep venous thromboses are complicated by pulmonary embolism. About 10% of patients with pulmonary emboli (PE) die within 1h of the PE event [1]. However, the treatment for PE with anticoagulants or surgery is highly effective, but complications occur frequently. Therefore, an accurate and prompt diagnosis is very important. The clinical picture of pulmonary emboli (PE) is non-specific, including sudden dyspnoea and hypoxemia, pleuritic pain, haemoptysis and substernal pressure, which may mimic coronary artery disease, other kinds of pulmonary diseases, gastroesophageal reflux, pleural disease or pericarditis. The risk factors for deep venous thrombosis in lower extremities and pulmonary embolism include inactivity/stasis, status postsurgery, presence of malignancy, oestrogen use, smoking and hypercoagulable state.
In the diagnosis of pulmonary embolism, chest radiography is not an accurate diagnostic tool. Most patients (88%) who have pulmonary embolism have abnormal but non-specific chest radiographic findings, including atelectasis and parenchymal areas of increased opacity.
A diagnosis of pulmonary embolism with the perfusion scan is based on the presence of perfusion defects rather than on direct visualization of the embolus. Therefore, the result of the lungs’ perfusion scintigraphy, can be regarded, essentially, as a probability estimate of the presence or absence of pulmonary embolism that is based on the number and size of defects. Several well-defined interpretation schemes are used that divide lungs’ perfusion scan probabilities into three or four categories from normal to high probability.
3D volume rendering images of SPECT perfusion data are used for accurate local and volume diagnosis and following the patient’s recovery.
In this work, we apply 3D SPECT technology to pulmonary embolism patients as an innovation in 3D rendering and evaluation methods. Patterns of perfusion scans with Tc-99m microspheres can provide an estimation of the extent of pulmonary embolism (firm XL Sci-Tech produces and suppliesTechnetium-99m labelled microspheres for diagnostic purposes). Measurement of regional distribution of blood flow can help predict the consequences of lung resection or lung reduction surgery and cystic fibrosis, or radiation therapy. Four functional categories of lung pathology can be distinguished: the vascular occlusive state and the consolidative, obstructive, and restrictive states, resulting in detectable distortions of perfusion by Nuclear Medicine Imaging. Segmental or subsegmental hypoperfusion can be caused by obstruction of pulmonary vessels due to intra-or extravascular pathology, including perfusion emboli (PE).
SPECT techniques of lung studies in Nuclear Medicine were used in clinical diagnosis, exploiting the improvements in sensitivity and diagnostic accuracy that have generally accompanied the transition from 2-dimensional planar to 3-dimensional (3D) slice imaging, Filtering, thresholding and gradient are necessary tools in the production of diagnostic 3D images.
Volume data in SPECT lung examination, by rendering and shading, describe the lungs in 3-dimensions (3D) and offer information about the lung’s surface in angles around it. They are obtained by a sequence of 2D slices reconstructed from projections acquired around the lungs (figure 1). Volume visualization obtains volumetric signs useful in diagnosis, in an accustomed and more realistic way.
Accurate volume determination is useful in the evaluation of the lung status in pulmonary embolism follow-up. [21] to assess the diagnostic value and the practical usefulness of SPECT studies of the lung used computational 3-dimensional data analysis
In our study, a new easy and reliable algorithm used for lungs’ volume determination by 3D volume rendering SPECT images and the definition of the Lung Perfusion Index homogeneity (LPI) is calculated.
Our method for lungs’ volume determination by SPECT and 3D SPECT volume rendering surface images is demonstrated in this study. A GE SPECT gamma camera connected to the processing system GE Xeleris has been used for acquisition processing and reconstruction of the obtained lung images both planar and tomographic. Xeleris™ is the last generation of workstations for Nuclear Medicine to deliver modern, quantitative applications which give the certainty of absolute quantitation of imaging data. Reconstruction was performed by quantitative FBP by Hann filter (critical frequency 0.9) and Chang attenuation correction order 0, coefficient 0.11 in the GE Xeleris image processing system. Lung perfusion planar studies, by Tc99m microspheres, were completed in patients after pulmonary embolism events followed by SPECT and 3D SPECT volume rendering surface images.
Focal zones of relative hyper-perfusion (hot spots) on perfusion scintigraphy can be seen, which may lead to misinterpretation of the scan. The zones of apparent hyper-perfusion may reflect true local vasodilatation or preserved perfusion in an area of normal lung adjacent to abnormal lung regions.
The required input data for the creation of 3D surface images is a dataset containing slice images that have been previously reconstructed from the SPECT acquisition data. These slices may be in one of several planes: transaxial, sagittal, coronal, or oblique, and the orientation of the input data determine the orientation of the final 3D surface dataset. The 3D surface rendering reconstruction of the lungs is described, focused on the details and precision of the final surfaces through grading.
Volume Rendering
Volume visualization in nuclear medicine is a method of extracting meaningful information from volumetric data using, manipulating and rendering a sequence of 2D slices. Volume data are 3D entities that may have information inside them or at their surface and edges at angular views that can be obtained by 3D surface rendering images in different angular views. During rendering time [2], in order to give a new viewpoint, the step is to determine which of the reference (acquired) views contribute to the new one and if they overlap, combine them to produce the final volume (figure1).
Surface Images
3D images are reconstructed by surface rendering techniques. Organ surface volumes in Nuclear Medicine can be made from the scientific data, by outlining (thresholding) structures in the serial slices; after loading all of them, surface reconstruction is done. The result of tomographic reconstructions is a set of adjoining or superposed slices in which the basic element is a voxel, with the third dimension be equal to one pixel, as it represents volume. Voxels are reorganized and displayed in a 3D way by labelling each voxel with information concerning the distance and the angle of its surface
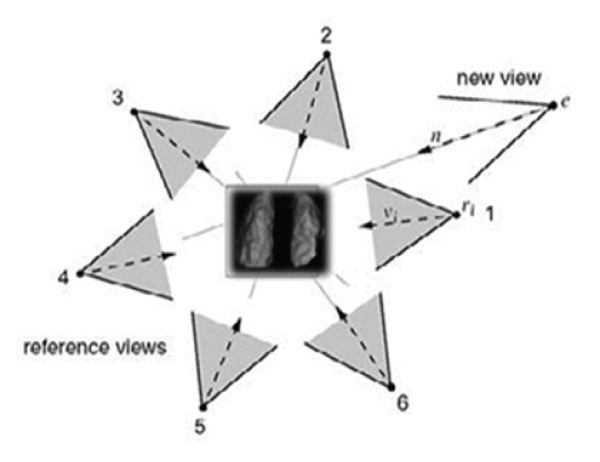
Figure 1: Distribution of angular acquired data from Lung SPECT. Reference Views will contribute to the interpolated new view. In this case views 1,2 will be selected to render the novel view e. (From Sainz M et al, modified).
Surface images are created and interpolated for any angle resulting in rotating surface images.
When viewed together with 2-dimensional data, 3D surfaces images give excellent information about the location, orientation and extent of regions of radioisotope uptake. 3D datasets are very strong visual representations of tomographic data and are mainly used qualitatively to help orientate the user with the tomographic slice data.
This emphasizes the 3D nature of nuclear data and strengthens the user's awareness of what the data represents. Information on perfusion details and function information of lungs from the 3D surface images are obtained.
When 3D surface images are generated, data are processed from each slice in order. This set of slice images contains information in the form of count values in volume elements (voxels), which represent the distribution of the radiopharmaceutical within the volume being imaged.
The 3D surface images which are produced provide views of a specific 3D surface of this certain volume.
This surface is defined by a count threshold which is applied to each of the voxels; all voxels which have count values greater than the threshold define the specific volume of the organ.
Surface Images Process
The imaged volume data which will be used for surface image generation is obtained from a set of transaxial, sagittal, coronal, or oblique slice images. Prior to the generation of the surface images, processing operations should be performed.
To improve the resolution of acquired data, the maximum possible matrix size both for data acquisition and processing is used. The visual quality of the surface images improves as the voxel size decreases. Therefore, a 128 x 128 resolution acquisition would be preferred and is used for acquiring data from some organs. In practice, however, a 64 x 64 matrix size acquisition is used in the lungs with excellent results; The use of the 64 x 64 matrix offers the advantage of reduced storage requirements and processing times.
Since the images depict a surface, an increased amount of smoothing may be desirable without losing surface special features, such as roughness or smoothness, which may be characteristics of an abnormality of the organ. The appearance of defects at parts of the organ that are not functioning is crucial too. By lungs’ emboli follow-up, in surface 3D images, the perfusion improvement quantitative signs, for the diagnosis, are emerging.
In order to evaluate the accuracy of these measurements, 5 cylindrical phantoms, [1000-1500] ml volume, containing Tc99m activity dispersed in simulated lung tissue (a mixture of styrofoam
scientific data, by outlining (thresholding) structures in the serial slices; after loading all of them, surface reconstruction is done. The result of tomographic reconstructions is a set of adjoining or superposed slices in which the basic element is a voxel, with the third dimension be equal to one pixel, as it represents volume. Voxels are reorganized and displayed in a 3D way by labelling each voxel with information concerning the distance and the angle of its surface.
Surface images are created and interpolated for any angle resulting in rotating surface images.
When viewed together with 2-dimensional data, 3D surfaces images give excellent information about the location, orientation and extent of regions of radioisotope uptake. 3D datasets are very strong visual representations of tomographic data and are mainly used qualitatively to help orientate the user with the tomographic slice data.
This emphasizes the 3D nature of nuclear data and strengthens the user's awareness of what the data represents. Information on perfusion details and function information of lungs from the 3D surface images are obtained.
When 3D surface images are generated, data are processed from each slice in order. This set of slice images contains information in the form of count values in volume elements (voxels), which represent the distribution of the radiopharmaceutical within the volume being imaged.
The 3D surface images which are produced provide views of a specific 3D surface of this certain volume.
This surface is defined by a count threshold which is applied to each of the voxels; all voxels which have count values greater than the threshold define the specific volume of the organ.
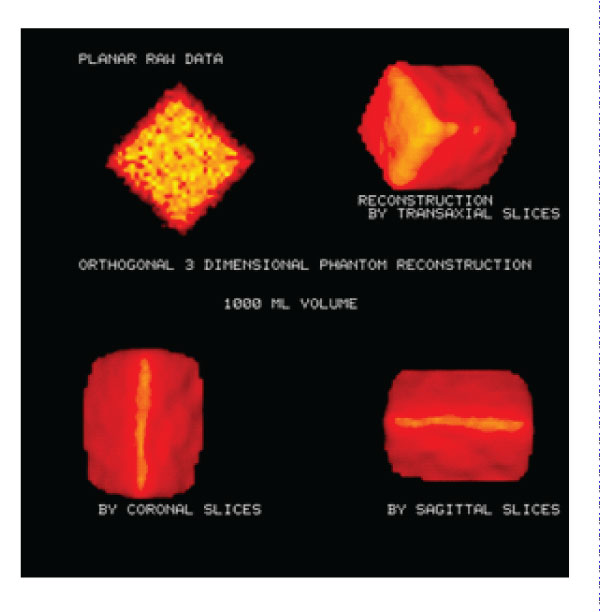
Figure 2: Phantom images: Transaxial, Coronal and 3D SPECT Phantom images. Planar phantom image and 3D phantom images were reconstructed on different axes. Volume calculation accuracy: 4.8%.
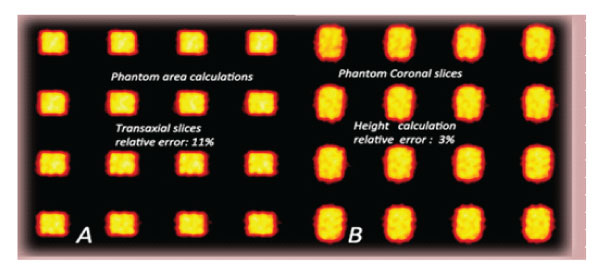
Figure 3: Phantom area calculations. A: Transaxial slices of phantom (1000ml, relative error:11%). B: Height calculations Coronal slices of phantom (1000m, relative error: 3%).
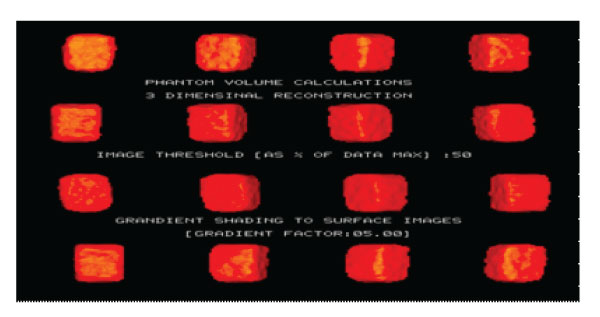
Figure 4: 3D SPECT Phantom images (3Dimensional reconstruction Volume calculations, 1000ml).
Semi-quantitative measurements in posterior and anterior planar images, divided into three equal segments, were obtained to show the acute situation. Recovery, after a few days’ therapeutic schemas, is shown. (figure5 A, B).
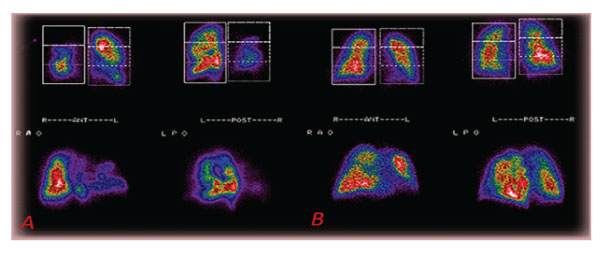
Figure 5: A: Planar pictures of multiple acute lungs embolisms in (patient 6). B: 80% Recovery 11 days post-therapy of the lungs’ perfusion of the same (patient 6).
event, in order to estimate the lung perfusion improvement, quantitatively.
From lung perfusion SPECT data, the volume of each reconstructed transverse slice was estimated by counting the voxels inside each slice. Our edge detection algorithm was used to mark the lung lobe’s edge and subtract the background. The total lung lobe volume was derived by summing the slices' volumes. Non-uniform attenuation compensation was performed by quantitative filtered back-projection. Image threshold 50% of data maximum was considered. 3D SPECT Lungs’ FBP
Data/Image Processing:
By SPECT lung studies (data reconstruction in transverse, coronal, sagittal slices as well as 3D images) in 22 of our patients, we have measured the lungs’ volumes. 14 of them had also a series of follow-up 3D SPECT studies after the pulmonary embolism reconstruction completed by Hann filter (critical frequency 0.9) and Chang attenuation correction order 0, coefficient 0.11.
SPECT lung study must be performed to estimate the lung perfusion improvement in detail. Data reconstructed in transverse/ coronal/ sagittal slices, as well as 3D surface images and a series of follow-up SPECT studies, after the pulmonary embolism event, must be used.
3D SPECT imaging, after the pulmonary embolism event, is accomplished, in order to estimate the lung perfusion improvement, quantitatively.
A lung lobe segment volume software is also determined, for the identification of diminished radionuclide concentration in lung part volumes and correlation between follow-up studies of SPECT lung perfusion Imaging (figure 6).
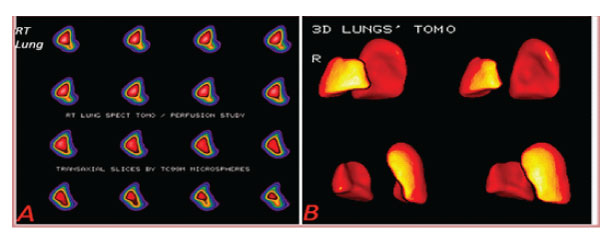
Figure 6: A: Lung right lobe transaxial slices (patient 12). B: Lungs’ 3D tomography Lower right lobe defect [ 9%], Upper right lobe perfusion defect (patient 12) (16% of total volume].
Comparison of Lung Perfusion Index (LPI) of repeat SPECT imaging in follow-up studies establishes the Pulmonary Improvement Factor [PIF]. Pulmonary Improvement Factor [PIF] of total lungs shows the improvement and progress in the follow-up procedure. The precision of the value estimation varies, depending on the size and clinical status of the lung lobe.
PIF= recovery volume/ event-time volume
From lung perfusion SPECT data, the volume of each reconstructed transverse slice can be estimated by counting the voxels inside each slice.
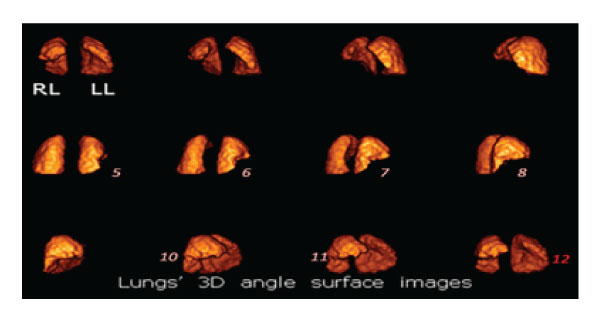
Figure 6.1: Sequential 3D angular images of lungs’ rendering surface volume in a SPECT perfusion study. There is a large triangular defect in the anterior basal and medial lobes of the right lung (RL) due to decreased blood perfusion caused by emboli (images 5,6,7,8,10, 11). The cavity in the left lung accommodates the heart (image 12).
In the following study 3D scintigraphic images are presented:
SPECT and 3D perfusion images were in moderate to good agreement for both the volume and severity of the radiotracer
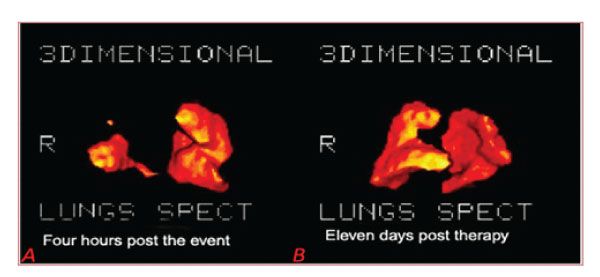
Figure 7: A: Four hours post the event: Lungs’ 3D tomography RT lobe embolism, Rt Lobe volume: 0.66Lit Total Volume: 2.85 Lit (patient 21). B: Eleven days post-therapy: Rt Lobe volume: 3.28 lit, Total Volume: 5.28 Lit (same patient 21).