Background: Deltamethrin (“δ”) treated durable lining (“DL”) or “insecticide treated plastic sheeting” (“δITPS”) were used for a long term village–scale malaria vector control (VC) program in 8 villages around Balombo town (Benguela Province, Angola) either alone (in 2 villages) or associated with Long Lasting deltamethrin Insecticide treated Net (“δLLIN”) Permanet© 2.0 (in 2 villages) or following Indoor Residual Spraying with lambdacyhalothrin “λ” (“λIRS”) (in 2 villages) while LLIN P2.0 alone were considered as “golden standard” and implemented in 2 villages. 2 models of ITPS were used, “Wall lining” and “Zero Fly” with different deltamethrin concentration. A comprehensive evaluation, entomological and parasitological, was initially planned for 5 years. Entomological evaluation was based upon the regular use of the classical CDC Miniature Light Trap inside human houses.
Results: During these 5 years (2 years before and 3 years after full vector control implementation) 202 CDC “night catching sessions” were done, representing 1880 “trap– night”, 1152 Anopheles were captured, belonging to 10 species, the main vectors (“MV”) were Anopheles funestus and An. gambiae. After implementation of VC the densities of “main– vector/traps” dropped by # 70%, similarly with the 4 VC methods (#63% with LLIN alone; #69% with the association LLIN +ITPS model “Zero Fly”; # 82% with ITPS model “Wall Lining” alone and #75 % after 2 rounds of λIRS followed by ITPS installation).
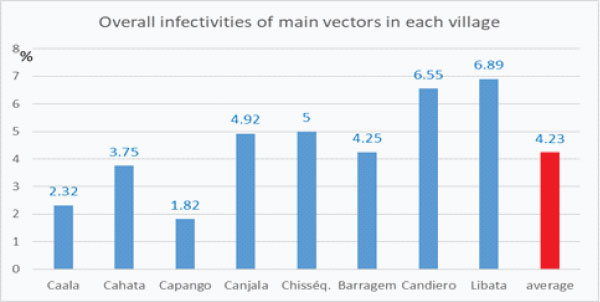
28 of the 1133 anopheles analyzed procured an Elisa positive test i.e. a general positivity index of 2.47%; with 8.00% (n= 50) for An. gambiae; 3.61% (n= 498) for An. funestus and 2.06% for An. marshalli (n= 243).
Infectivity of main vectors An. gambiae + An. funestus dropped, but not significantly, from 4.53%, (n= 375) to 2.59% (n=193) after vector control implementation.
Overall Inoculation rates decreased by #80% after Vector Control: #–60% with LLIN alone; # 80% with durable lining, similarly alone (–81%), or associated with LLIN (–79%), or following λ IRS (–80%).
Conclusions: The fact that Durable Lining, even alone, were as efficient as Indoor Residual Spraying to reduce biting rate and inoculation rate of main vectors while having a longer lasting activity, and that the association Long Lasting Treated Nets + Durable Lining was not much better than a single method are important information for the National Malaria Control Program and other Malaria Control programs.
Keywords: Anopheles, vector control, malaria, Angola, entomological evaluation, deltamethrin treated durable lining, Long Lasting insecticide (deltamethrin) treated Nets (LLIN), lambdacyhalothrin Indoor Residual Spraying.
According to the recent WHO Malaria report 2021 (Regional data and trends) “in 2020, six countries in sub–Saharan Africa, accounted for 55% of all malaria cases globally: Nigeria (26.8%), The Democratic Republic of the Congo (12.0%), Uganda (5.4%), Mozambique (4.2%), Angola (3.4%) and Burkina Faso (3.4%)”. Increase in mortality rate of between 5% and 25% were seen in eight countries: Angola, The Democratic Republic of the Congo, Guinea–Bissau, Liberia, Namibia, South Sudan and Uganda” [1]
In Angola, the whole population of 31 million inhabitants is at risk of malaria with some 15,928,260 presumed and confirmed (estimated 7,052,636) malaria cases with 11 814 reported (13 425 estimated) deaths.
Due to insecticide [2] and drug resistance [3–5] the situation is worsening; 2,548 deaths from malaria were registered in the first quarter of 2020, plus 467 deaths compared to the same period in 2019. From January to March 2020, 2,065,673 cases and 2,548 deaths were registered, 190,398 more cases than in 2019.
Angola is still among the countries with the highest number of malaria cases and deaths (3% of the global cases and deaths) [6]. Between 2015 and 2018, there was an increase in malaria cases, from 200 to 288 per 1000 of the at risk population. According to the National Malaria Control Programme (NMCP) 8% of all reported yearly malaria cases in 2017 were severe malaria.
The strategy of NMCP combines preventive action and case management, mainly national scale distribution of Long lasting insecticide treated nets (LLIN), through different channels, and intermittent preventive treatment (IPT) to pregnant women [7] Rapid Detection tests (RDT) are distributed to improve timely reliable testing diagnosis [8] with treatments based on Artemisin Combined Therapy (“ACT”) since 2006 [3,9,10].
The recent Sixteenth meeting Vector Control Advisory Group (VCAG) (2022) of WHO [11] examined 4 kinds of “new” approaches for vector control:
As it can be noticed no one of these methods has yet procured epidemiological data and is included in National Malaria Control Program which are mainly concentrated on IRS and LLIN for adult control while Dr P. Alonso (Director of the WHO Global Malaria Action Program) underlined in his recent interview “we need of new technological tools”
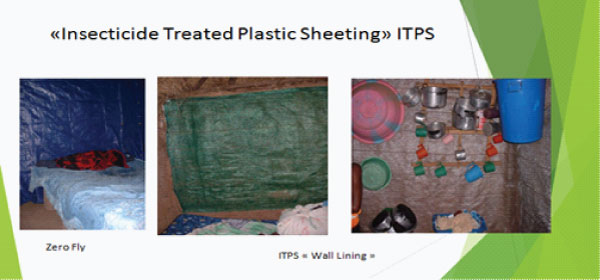
In Angola, due to the failure of the recent Indoor Residual Spraying (IRS) operation [12] an accent for vector control was deliberately given to large scale distribution of Long Lasting Insecticide Treated Nets (LLINs) while researches for new approaches, such as durable lining, deserves special attention [13–15] Actually Insecticide Treated Plastic Sheeting (ITPS) often called “durable lining”, represent a new tool, pinned on the wall inside human houses they could easily and usefully replace IRS with their well–known operational issues. ITPS were recently used in refugees camps [16–17] and experimental huts, alone [18] or in combination with LLIN [19,20]. Organophosphate treated ITPS were used with LLIN against pyrethroid resistant An. gambiae in Côte d’Ivoire [21] while carbamate–treated ITPS were used in combination with deltamethrin treated LLIN for controlling pyrethroid resistant An. gambiae [19,22] .They were recently tested in Huambo area (Angola) close to Balombo, and Nigeria [14], in several other countries in Africa and Asia [13] and some operational issues were raised [23]. Their acceptability was studied in Papua–New Guinea [24] as well as in Equatorial Guinea, Ghana, Mali, South Africa, and Vietnam [13]. The model called “Zero Fly©” (with higher concentration in deltamethrin) was tested in India [25–27].
According to these positive entomological data observed elsewhere and in Angola with Insecticide Treated Plastic Sheetings, a long term village scale malaria vector control programme was implemented with the National Malaria Control Program in Balombo area (Benguela Province) for a long term village scale comprehensive evaluation of the entomological, parasitological, immunological efficacy and acceptability of ITPS (2 models) either alone or associated with LLIN (« Perma®Net »2.0) or following 2 rounds of lambdacyhalothrin Indoor Residual Spraying and partial data were already published [28–35]. It appeared important to present the “starting point” of this program with the entomological observations while parasitological one will be published soon.
The National Malaria Control Programme (NMCP) identified eight villages around the Balombo Municipality, in the Benguela Province, central Angola (12°21’S; 14°46’E), 150 km east of Lobito Town and 600 km south–east from Luanda the capital (Figure 1).
It is a humid mountainous area at an altitude of # 1,200 meters with tropical savannah forests (greatly damaged for agricultural purposes) and fast running rivers; there is a long rainy season (October to May) and a short dry season (June to September).
These villages are far enough from each other so that it could not be expected that some mosquitoes could actively fly from one to another one and induce some bias for entomological evaluation.

Figure 1: Map of the area in Angola and localization of the 8 studied villages (from Brosseau et al., 2012).
Census
Before the trial, a comprehensive census was done in each village and each house received a number which was reported on the door, noticed for GPS mapping and used for randomization. The demographic and geographic situation of each village is indicated table 1. The programme included 5322 people in 1600 houses at its beginning.
Table 1: Census of the 8 targeted villages at the beginning of the trial (February 2007).
Villages |
Nb Inhabitants |
Nb Houses |
Longitude E |
Latitude S |
Caala |
792 |
238 |
14°47’ |
12°25’ |
Cahata |
484 |
138 |
14°48’ |
12°20’ |
Capango |
137 |
60 |
14°50’ |
12°24’ |
Canjala |
873 |
401 |
14°44’ |
12°21’ |
Chisséquélé |
418 |
181 |
14°47’ |
12°22’ |
Barragem |
620 |
134 |
14°47’ |
12°21’ |
Candiero |
654 |
190 |
14°45’ |
12°22’ |
Libata |
1344 |
258 |
14°46’ |
12°20’ |
Total |
5322 |
1600 |
Tools used for vector control
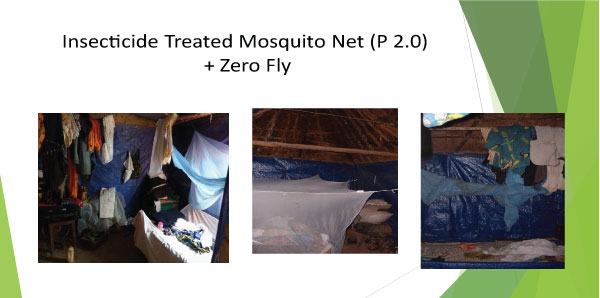
4 tools were used for vector control (pictures 1 and 2):
Deltamethrin (C22H19Br2 NO3 ) is a pyrethroid ester insecticide largely used (with other pyrethroid such as permethrin, alphacypermethrin etc) in the manufacture of long–lasting insecticidal mosquito nets. Lambdacyhalothrin (C23H19ClF3NO3) in 2.5% capsule suspension formulation it has been approved by experts of the WHO in 2000.
Vector control operations (VCOp)
LLIN were given at the beginning of the programme in 2 villages (Caala and Cahata) while the 6 other villages remained without vector control during 2 years (2007–2008) (“control villages”) (period called “before VC”) and the 3 following years (2009–2010–2011) were called “period after VC”.
The details of vector control operations are gathered in Table 2.
Table 2:Vector control operations (δLLIN = PermaNet 2.0 Long Lasting Insecticide deltamethrin Treated Nets; ZF= Insecticide deltamethrin Treated Plasting Sheeting model Zero Fly; WL= Insecticide deltamethrin Treated Plastic Sheeting model Wall Lining; λIRS 1= Insecticide Residual Spraying with lambdacyhalothrin Round 1; λIRS 2= Insecticide Residual Spraying with lambdacyhalothrin Round 2).[*target: 1LLIN/house; ** target: 1LLIN/sleeping unit] [xx = no vector control done; C= control villages].
Villages |
Feb-07 |
Feb-08 |
Dec-08 |
Jun-09 |
Jan-10 |
Caala (469 sleeping units) |
δLLIN* |
δLLIN** |
δLLIN** |
xx |
xx |
Cahata (442 sleeping units) |
δLLIN* |
δLLIN** |
δLLIN** |
xx |
xx |
Capango |
C |
C |
93 δLLIN |
xx |
xx |
Canjala |
C |
C |
422 δLLIN |
xx |
xx |
Barragem |
C |
C |
5554 m2 WL |
xx |
xx |
Chisséquélé |
C |
C |
5441 m2 WL |
xx |
xx |
Candiero |
C |
C |
λIRS 1 |
λIRS 2 |
WL |
Libata |
C |
C |
λIRS 1 |
λIRS 2 |
916 ZF |
The average amount of insecticide /house was greatly different according to the vector control method implemented, from # 1 g a.i. deltamethrin/house with LLIN (almost the same with λ IRS) to 13.1 gr a.i./house with Zero Fly ITPS alone (Table 3).
Table 3:Average amount on insecticide per house according to the various vector control method implemented (δ= deltamethrin; λ= lambdacyhalothrin).
village |
method of VC |
amount of a.i./house |
Caala |
LLIN only "1 net/house" |
1,08 gr a.i. δ/house |
LLIN only full coverage |
2,06 gr a.i. δ/house |
|
Cahata |
LLIN only "1 net/house" |
1,61 gr a.i. δ/house |
LLIN only full coverage |
2,75 gr a.i. δ/house |
|
Barragem |
WL only |
7,05 gr a.i. δ/house |
Chisséquélé |
WL only |
5,11 gr a.i. δ/house |
Capango |
LLIN + ZF |
11,77 gr a.i. δ/house |
Canjala |
LLIN+ ZF |
9,92 gr a.i. δ/house |
Libata |
IRS R1 |
1,48 gr a.i. λ/house |
IRS R2 |
1,07 gr a.i. λ/house |
|
ZF only |
13,79 gr a.i. δ/house |
|
Candiero |
IRS R1 |
1,28 gr a.i. λ/house |
IRS R2 |
1,31 gr a.i. λ/house |
|
WL only |
4,16 gr a.i. δ/house |
Mosquito collections and biological analysis
Entomological surveys were regularly done (from February 2007 to December 2011) and based on the classical CDC Light Traps (CDC–LT) thanks to their reproducibility, if the same traps are regularly used in the same houses and they are independent of the collector’ skill or attractiveness [36–39]. CDC were also used for the evaluation of the efficacy of pyrethroid treated nets in Tanzania [40] and, in conjunction with human landing catches, for the evaluation of LLIN universal coverage in Uganda [41]. In Northern Tanzania “mosquitoes were sampled using CDC miniature light trap” for the evaluation of deltamethrin treated wall lining against Anopheles gambiae s.l. [42]
For each session, 10 traps were installed inside initially randomly selected houses, which were kept the same for the whole entomological survey. Traps were switched on at 6 pm and switched off at 6 am the following day.
Mosquitoes were sorted out at the genus level and Anopheles species determined with classical keys [43], then isolated in plastic tubes and kept in dry atmosphere until their identification at the species level (An. gambiae complex) and classical circumsporozoite ELISA analysis [44,45]. Molecular identification of members of the An. gambiae complex was done following the RFLP–PCR assay developed by Fanello et al.(2002) [46] which allows, with one amplification and a digestion with HhaI restriction enzyme, the differentiation between An. gambiae and An. coluzzii, as well as the other members of the complex.
Following Sriwichai et al. (2015) [39] method, absolute vectors numbers were converted into “capture rates” (i.e., number of vector per trap, per year and per village). For each year and each village, the total number of An. gambiae and An. funestus (“Main Vectors” or “MV”) collected was divided by the total number of CDC–LT implemented to get a proxy of the “number of Anopheles/trap” considered as a reliable indicator of the “density”/house with a figure of their evolution according to the implementation of each vector control methods.
Combining these data with infectivity rates gave some proxy of the “indoor risk of inoculation” and its evolution according to the vector control methods implemented.
The entomological inoculation rate (h) was calculated with the classical Ross ‘formula [47] h= ma.s (with ma = number of bite received in one day by one human being; and s = infectivity rate) considering here the “capture rate” of Main Vectors (MV) for “ma”.
Statistical analyses of Anopheles samples collected by traps were done by the non–parametric Mann–Whitney test; graphics were prepared with the Graphpad software.
Anopheles species caught
From February 2007 to December 2011, 202 catching sessions with CDC light traps were implemented in the 8 villages representing a total of 1,880 trap–nights which caught 1,152 Anopheles specimens, belonging to 10 taxa including 9 species and one species complex (Gambiae) (Table 4). The main Anopheles were An. funestus (44.7%) abundant in every village, followed by An. marshallii (21.0%), An. maculipalpis (17.8%), An. ziemanni(6.5%), and An. gambiae s.l. (4.8%). The other 5 species including An. pharoensis (1.9%), An. nili (1%), An. coustani, An. tenebrosus(0.9%), and An. hancocki (0.6%) were scarce.
Only An. gambiae and An. funestus were considered for further analysis according to the well–known few, if any, vectorial capacities of other species [43].
The molecular analysis of a sub sample of 45 An. gambiae s.l. specimens out of the 55 caught showed the preponderance of An. gambiae (82.2%) (formerly called “An.gambiae S form”), with only 3 specimens of An. coluzzii and 5 An. arabiensis.
Table 4: Anopheline species caught by CDC Light Traps inside human houses of the 8 surveyed villages from 2007 to 2011 (Chiss. = Chisséquélé; Barr. = Barragem; Candi.= Candiero).
villages |
Caala |
Cahata |
Capango |
Canjala |
Chiss. |
Barr. |
Candi. |
Libata |
Total |
An. gambiae |
15 |
11 |
8 |
1 |
8 |
1 |
8 |
3 |
55 |
An. funestus |
71 |
74 |
119 |
60 |
32 |
46 |
56 |
55 |
513 |
An. marshalli |
37 |
30 |
79 |
22 |
18 |
11 |
26 |
20 |
243 |
An. ziemanni |
19 |
4 |
28 |
3 |
6 |
3 |
4 |
8 |
75 |
An. maculipalpis |
43 |
24 |
72 |
6 |
27 |
7 |
19 |
8 |
206 |
An. hancocki |
0 |
0 |
5 |
0 |
0 |
1 |
1 |
0 |
7 |
An. nili |
7 |
0 |
1 |
2 |
1 |
0 |
0 |
0 |
11 |
An. pharoensis |
3 |
2 |
14 |
0 |
2 |
0 |
1 |
0 |
22 |
An. coustani |
0 |
1 |
4 |
0 |
3 |
0 |
2 |
0 |
10 |
An. tenebrosus |
2 |
1 |
6 |
0 |
0 |
0 |
1 |
0 |
10 |
total |
197 |
147 |
336 |
94 |
97 |
69 |
118 |
94 |
1152 |
In their pyrethrum spray sampling Cuamba et al. (2006) [2] found mainly An. gambiae M form (= An. coluzzii) as resting inside houses but “the highest proportion of S-form (20%) was in samples from Huambo, in the humid highlands”. The fact that An. gambiae was predominant in humid area or season was also already noticed in Lobito town (Angola) [48].
Evolution of densities of main malaria vectors according to village
The yearly evolution of the capture rate of the main vectors, An. gambiae s.l. and An. funestus, in each village during the 5 years of the study, is shown in Table 5.
Table 5: Evolution of density/traps of Main Vectors An. funestus + An. gambiae according to year and village.
Villages\Years |
Y 2007 |
Y 2008 |
Y 2009 |
Y 2010 |
Y 2011 |
Caala |
0.56 |
0.42 |
0.35 |
0.12 |
0.47 |
Cahata |
1.29 |
0.43 |
0.18 |
0.12 |
0.17 |
Capango |
1 |
1.1 |
0.15 |
0.45 |
0.23 |
Canjala |
0.5 |
0.38 |
0.07 |
0.1 |
0.53 |
Chisséquélé |
0.54 |
0.4 |
0.05 |
0 |
0 |
Barragem |
0.58 |
0.25 |
0.25 |
0.02 |
0.07 |
Libata |
0.33 |
0.53 |
0.15 |
0.08 |
0.13 |
Candiero |
0.67 |
0.47 |
0.07 |
0.12 |
0.3 |
It clearly appeared (graph. 2a; 2b) that:
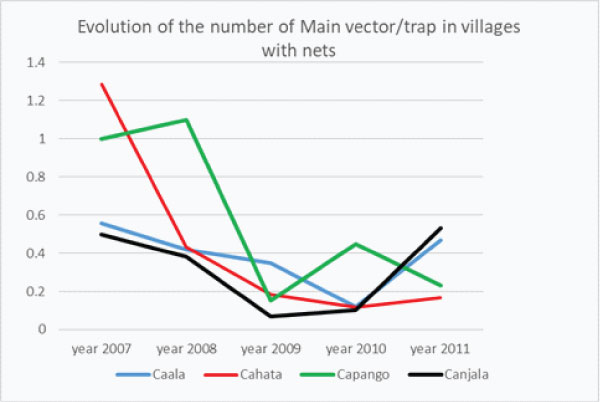
Graph 2a: Yearly Evolution of the “number of Main Vectors/trap” in villages with δLLIN alone (Caala and Cahata) or association δLLIN + ZF (Capango and Canjala).
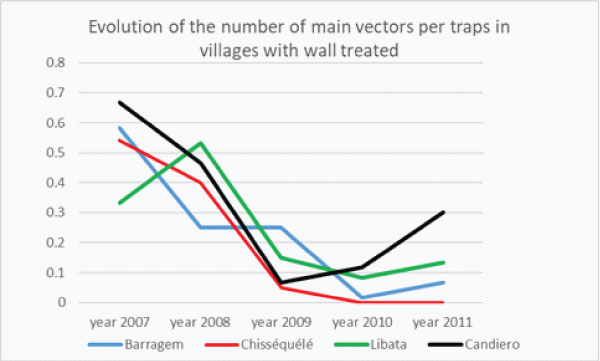
Graph 2b: Yearly Evolution of the “number of Main Vectors/trap” in villages with Wall Lining (Barragem and Chisséquélé) or Indoor Residual Spraying then durable lining (Libata, Candiero) (Capango and Canjala).
In the 6 control villages the natural evolution of the densities of MV/trap the first 2 years, i.e. without any implementation of vector control were different (graph–2c), remaining almost the same in Capango, slightly decreasing in Canjala, Chisséquélé; greatly decreasing in Barragem and Candiero; but increasing in Libata.
The first year after Vector Control the drop of the densities of Main Vector/trap was spectacular in every villages except Barragem (graph 2d) where the drop in the densities of MV/Trap was observed in 2010 the following year (graph. 2b).
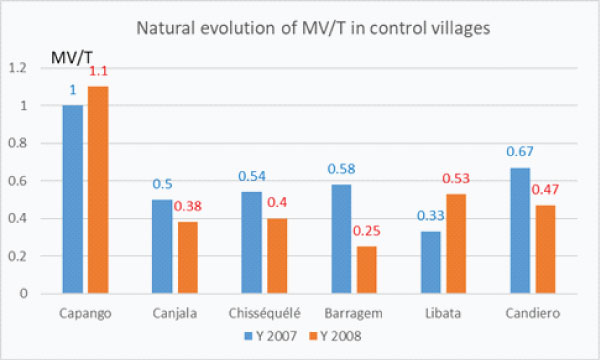
Graph 2c: Natural evolution of the densities of main vector per trap (MV/T) in the 6 control villages before Vector Control implementation.
The first year after Vector Control the drop of the densities of Main Vector/trap was spectacular in every villages except Barragem (graph 2d) where the drop in the densities of MV/Trap was observed in 2010 the following year (graph. 2b).
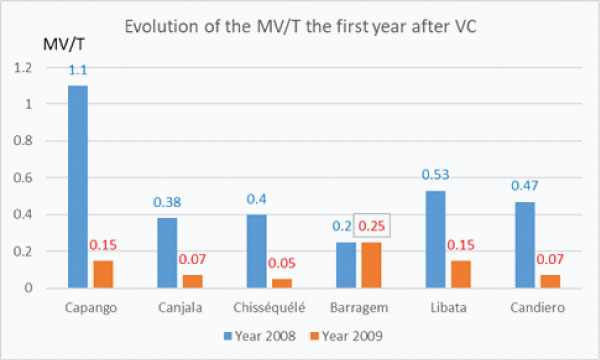
Graph 2d: Evolution of the densities of the Main Vector/trap the first year after Vector Control implementation.
The densities of Main Vector /trap the 3rd year after implementation of Vector Control presented a general increase excepted in Capango (LLIN+ZF) where densities still decreased and Chisséquélé (WL) where densities remained nil (graph 2e).
In the 2 villages where LLIN were given with full coverage in 2008 (Caala and Cahata) 3 years after full coverage the densities of Main Vector increased (in Caala) or slightly increase (in Cahata) (graph. 2a) showing the worrying reduction of their protective efficacy for inhabitants.
In the 2 villages with ITPS only (Barragem and Chisséquélé) the densities remained very low the 3rd year (graph 2e).
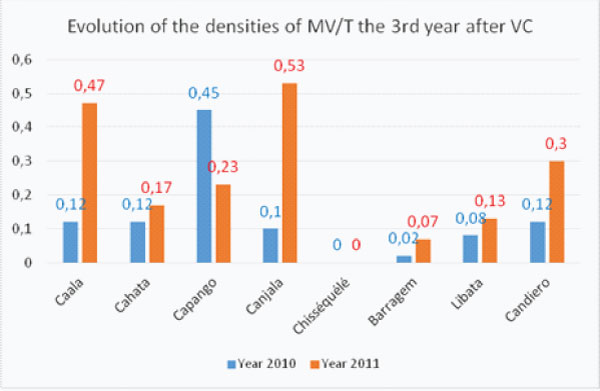
Graph 2e: Evolution of the densities of the Main Vectors/trap (MV/T) the 3rd year after complete Vector Control implementation.
When checking the evolution of the average monthly number of main vectors per trap according to the method of vector control it must be highlighted 3 main points: a) the drop in February 2009 soon after VC implementation; b) the long period with very low densities of main vectors inside human houses and c) the increase the third year, but which was not observed in villages with WL (graph 2f).
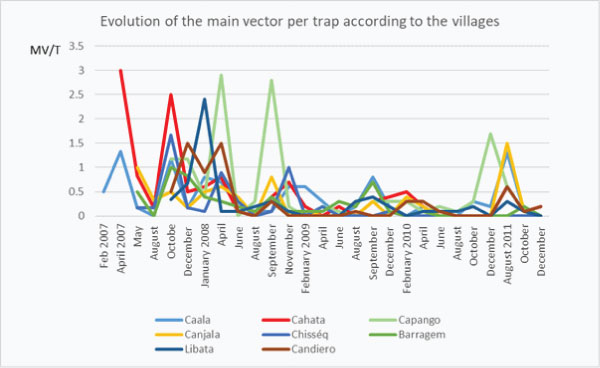
Graph 2f: Long term (5 years) of monthly evolution of densities of main vectors/house according to the method of vector control. (nb MV/t= number of main vector per trap).
When checking the evolution of densities of main vectors/trap before and after implementation of vector control in each village it appeared that the decrease was significant in all villages but Caala (LLIN) and Candiero (IRS) (graph 2g).
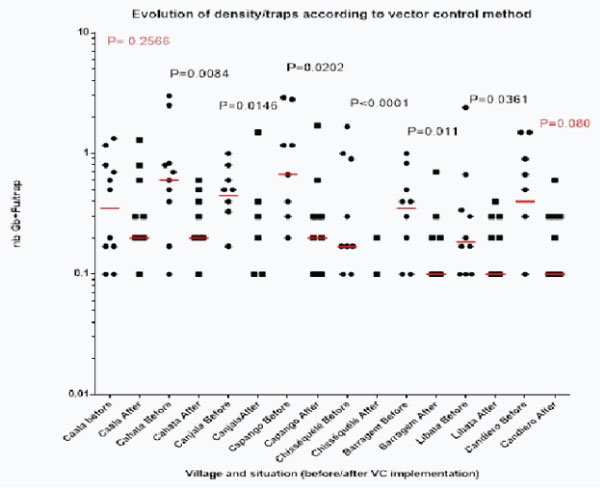
Graph 2g: Long term (5 years) of monthly evolution of densities of main vectors/house according to the method of vector control. (nb MV/t= number of main vector per trap).
Evolution of densities of main malaria vectors according to method of vector control
The four methods of vector control showed the same general trends for the evolution of the average yearly densities of main vectors caught by CDC Light Traps inside human houses (graph. 3a) with the striking drop in 2009 soon after vector control operations and the increase in 2011 i.e. 3 years after complete coverage while in village with WL the densities remained low.

Graph 3a: Evolution of yearly densities of main vectors/trap according to the method of vector control implemented.
Actually every method induced a striking reduction of the main densities/traps (# 71%) (Table 6).
Table 6:Evolution of the average of An. gambiae + An. funestuscaught by CDC Light Traps in paired villages according to the method of vector control implemented, before and after VC implementation.
Methods of VC |
Years 2007-2008 |
Years 2009-2010-2011 |
Diff. |
LLIN |
0.58 |
0.217 |
-62.80% |
LLIN +ZF |
0.73 |
0.23 |
-68.70% |
WL |
0.39 |
0.07 |
-82.20% |
IRS then ITPS |
0.5 |
0.127 |
-74.70% |
Statistical analysis of the distribution of densities of main vectors per trap before versus after vector control (graph 3b) showed that the reduction was significant for each method:
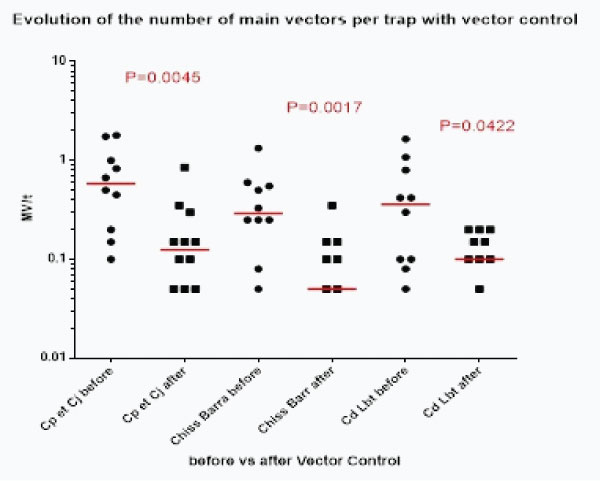
Graph 3b:Evolution of the distribution of the number of main vectors /trap (and median, in red) before/after mplementation of every vector control method.
Each method reduced statistically the number of main vector (MV) by traps and it is worth noticing that durable lining alone reduced also statistically this number of MV/trap
Infectivity of main vectors and its evolution according to VC implemented
28 of the 1133 anopheles analyzed procured an Elisa positive test i.e. a general positivity index of 2.47%; with 8.00% (n= 50) for An. gambiae; 3.61% (n= 498) for An. funestus and 2.06% for An. marshalli (n= 243) (Table 7a).
Table 7a: Infectivity of the different Anopheles species for the 5 years of the study (n= number of specimen tested; E+= number of specimen positive with ELISA test).
Species |
E+ |
n |
s (%) |
An. gambiae |
4 |
50 |
800.00% |
An. funestus |
18 |
498 |
3,61 |
An. marshalli |
5 |
243 |
2,06 |
An. ziemanni |
0 |
75 |
0,00 |
An. maculipalpis. |
0 |
206 |
0,00 |
An. coustani |
0 |
7 |
0,00 |
An. nili |
0 |
11 |
0,00 |
An. pharoensis. |
1 |
22 |
4,55 |
An. hanckoki |
0 |
10 |
0,00 |
An. tenebrosus |
0 |
10 |
0,00 |
An. rufipes. |
0 |
1 |
0,00 |
Total |
28 |
1133 |
2,47 |
Elisa tests were performed on 548 specimens of An.gambiae and An.funestus and 22 appeared positive i.e. an overall infectivity rate of main vectors of 4.01% (table 7b) which is well in the range of the usual sporozoite index reported elsewhere [43].
Data of the number Elisa tests performed and positive one, for each year and each village, are reported Table 7b.
Table 7b: Infectivity of An.gambiae + An.funestus in each village each year.
Villages/ Years |
Caala |
Cahata |
Cap. |
Canj. |
Chiss. |
Barr. |
Cand. |
Lib. |
Total |
Y 2007 |
0/19 |
Jan-36 |
0/18 |
12-Jan |
13-Jan |
14-Jan |
16-Jan |
8-Jan |
6/136 |
Y 2008 |
25-Jan |
26-Jan |
1/33 |
23-Feb |
24-Jan |
0/15 |
28-Jan |
Mar-32 |
11/239 |
Y 2009 |
21-Jan |
11-Jan |
0/9 |
0/4 |
0/3 |
15-Jan |
0/4 |
0/9 |
Mar-76 |
Y 2010 |
0/7 |
0/7 |
0/10 |
0/6 |
0 |
0/1 |
4-Jan |
0/5 |
Jan-40 |
Y 2011 |
0/14 |
0/5 |
0/7 |
0/16 |
0 |
0/2 |
9-Jan |
0/4 |
Jan-57 |
total |
Feb-86 |
Mar-85 |
2/110 |
Mar-61 |
Feb-40 |
Feb-47 |
Apr-61 |
Apr-58 |
22/548 |
From this comprehensible table it is possible to sort out 3 interesting points:
After a plateau the first 2 years there is remarkable linear evolution of the infectivity (y=0.999x + 5.695; R2=0.9784) between 2008 and 2011.
In 2009, the first year after vector control implementation, the infectivity decreased by 14% compared to 2008, then 36% from 2009 to 2010 then 30% from 2010 to 2011 meaning that in three years after vector control (from 2008 to 2011) the infectivity of main vectors decreased by 62%.
It appeared villages with low infectivity # 2% (Capango, Caala), “middle” infectivity, on the range of the average (Cahata, Canjala, Barragem) and villages with high infectivity (Candiero, Libata) of main vectors (graph 4b)
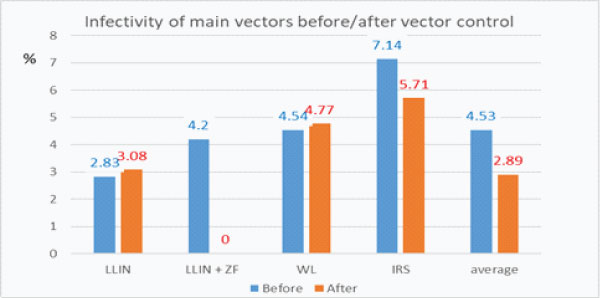
Graph 4c: Evolution of the infectivity of main vectors before and after vector control implementation.
Considering only the 6 villages initially “control” the infectivity dropped form 5.20% (n= 269) before vector control implementation to 2.78% (n=108) after, which is not significant (X2 corrected= 0.56; P=0.42; OR=0.52 [0.15–1.85]).
It did not seem that the 2 Rounds of λIRS followed by the full coverage in ITPS had induced a particular reduction of infectivity of vectors in the 2 villages involved.
On the other hand the overall infectivity of An.gambiae (4E+/50 specimen analyzed i.e. 8%) was not statistically different from the An.funestus one (18D+ /493 i.e. 3.65% (X2 corrected=2.21; P= 0.267; OR=0.44 [0.14–1.34]).
Evolution of the “Inside House Inoculation Risk” according to vector control
From the table 6.gathering information on the evolution of the densities of main vector (“ma”) with vector control implementation and Table 7b dealing with the evolution of their infectivity (“s”) it is possible de make an evaluation of the entomological inoculation rate before and after vector control with the Ross formula h= ma.s (Table 8).
Table 8: Evolution of the Entomological Inoculation Rate(h) per day “hd” per month “hm” or per year “hy” according to the method of vector control implemented (* we used the average infectivity rate of main vector in the 6 treated control villages).
Methods of VC/parameter |
LLIN |
LLIN+ZS |
WL |
IRS |
|
Before |
ma |
Jan-00 |
0.734 |
0.393 |
0.5 |
s |
Jan-00 |
4.20% |
0-Jan |
0-Jan |
|
hd |
0.01648 |
3.08% |
0.0179 |
0.0357 |
|
hm |
0-Jan |
37/40 |
0-Jan |
1-Jan |
|
hy |
5.933 |
1110.00% |
6.43 |
12.85 |
|
After |
ma |
0-Jan |
0.23 |
0.07 |
0.127 |
s |
0.0308 |
0.0278* |
0.0476 |
0.0571 |
|
hd |
0.0067 |
0.0064 |
0.0033 |
0.00725 |
|
hm |
0.2 |
0.1918 |
0.0999 |
0.2175 |
|
hy |
2.403 |
2.302 |
1.2 |
2.61 |
It thus appeared a great reduction of the entomological inoculation rate with each one of the vector control method implemented (graph. 5a) which can be estimated at 59.5% with LLIN, and # 79.3% with the association MMIN+ZF, 81.3% with Wall Lining alone and 79.7% with IRS followed by WL with an average of 77% reduction of the entomological inoculation rate after vector control implementation (Graph 5b).
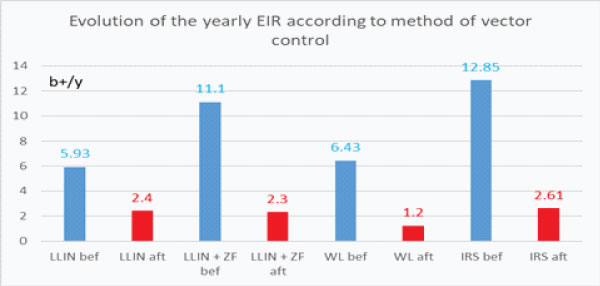
Graph 5a: Evolution of the yearly entomological inoculation rate according to the method of vector control implemented (b+/y number of infected bite/human being/year). (bef.= before; aft.= after).
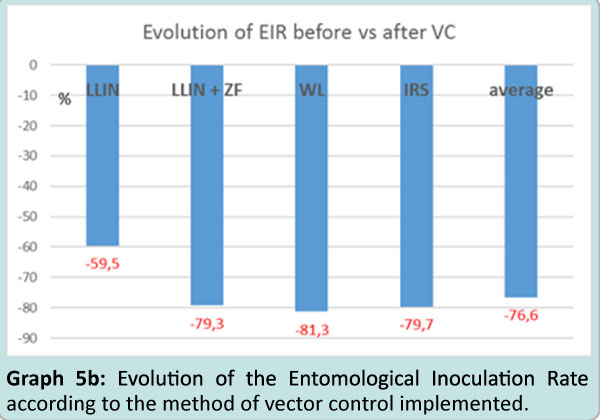
Graph 5b: Evolution of the Entomological Inoculation Rate according to the method of vector control implemented.
This several years trial carried in complete natural field conditions showed that the 4 methods tested induced a clear decrease of the number of main vectors (An.gambiae+ An.funestus) per house in using CDC Light Trap (–63% with δLLIN alone; –69% with LLIN + Durable Lining Zero Fly; –82% with durable lining “Wall Lining” alone and –75% with 2 rounds of λ lambdacyhalothrin followed by WL installation). The four method had same efficacy at that level. It appeared a clear drop the year after complete installation of vector control tools but an increase the 3rd year which is matter of concern. Field surveys showed that in 3 years several nets were torn and thrown outside, discarded in the field, the same for plastic sheetings misused for different purposes such as thread to hang up washed clothes etc. Nevertheless this drop in malaria vector densities in human houses must be kept in mind. The infectivity of vector was in the usual range of other report dealing with these anopheles species [43] and, even not statistically significant, decreased by vector control implementation.
What appeared worth underlining is the drop of entomological inoculation rate by the four tools (–60% with LLIN; and similarly # 80% with the three other methods giving an average of a 78% reduction of inoculation in these villages, a value similar to the one reported elsewhere with Insecticide Treated Nets [49,50]. The similar values on the reduction of inoculation rate obtained by ITPS alone such as IRS is one of the positive input of this program and an interesting asset for the National Malaria Control Program.
As it was well underlined [15] «Insecticide–treated durable wall lining (ITWL) may represent a new paradigm for malaria control as a potential complementary or alternate longer–lasting intervention to IRS” and it could also be method to control other vector–borne diseases such as leishmaniasis [51,52] and in urban as well as rural areas [13–15,23]. Their “entomological efficacy and household acceptability” were studied in Africa and South–East Asia [13,53] in Papua New Guinea [24,54].
Several studies were devoted to Insecticide Treated Plastic Sheetings [18], in experimental huts [55,56] or at village level [57].
ITPS were tested treated with pyrethroid permethrin [20] or deltamethrin [42]), or Organophosphate [21] or Carbamate [19,22] in association with pyrethroid treated long lasting nets to deal with the burning issues of pyrethroid resistant vectors.
In Tanzania Emidi et al [58] tested the entomological efficacy against An. gambiae and An. funestus of a novel non–pyrethroid insecticide treated durable wall liner treated with a mixture of two non–pyrethroid insecticides namely abamectin and fenpyroxinate [56,57], showing their deterrent effect.
Durable lining “Zero Fly” was tested with success in India [25–27] where it was considered as “a supplementary vector control intervention and ZVDL (for Zero vector durable lining) has the potential to become a viable alternative to IRS in malaria endemic areas”.
According to these studies, the Balombo village scale protocol was implemented to get reliable data for the National Malaria Control Program with its national distribution of Long Lasting Insecticide Treated nets, while the possibility of using the Insecticide Treated Plastic Sheeting (ITPS) could be envisaged due to the “difficulties in organizing first indoor spray programme against malaria in Angola” [12].
Compared to classical IRS the Durable Lining have several advantages such as the actual community involvement as they cut DL at the right dimension and pinned themselves the plastic sheeting on the walls inside their own houses (while for Indoor Residual Spraying there are external team who enter the houses for spraying and this is quite often not well accepted). Being on the wall ITPS did not interfere with movement inside the small room, a point often noticed when nets are hanged over sleeping units such as mattress and other unrolled in entrance or living rooms. This participates to their acceptability as it was well noticed recently in Huambo area [14] close to Balombo, and elsewhere [15,24]. On the other hand they did not induce the “reject behaviour” for claustrophobia as it was observed with bed nets. In Balombo houses several pictures and furniture were noticed hanged on the ITPS showing the appreciation of their “aesthetic value” by populations.
Long lasting efficacy of ITPS has also a great operational advantage, being still efficient several years after their installation compared to the short efficacy of IRS, usually of 3 to 6 months and as recently reported “durable lining can be considered an advanced form of long–lasting IRS where insecticide is gradually released form an aesthetically attractive wall lining to provide vector control for several years”[14].
It has to be underlined that, in the Balombo trial, ITPS alone were as efficient as IRS in reducing the inoculation rate by some 80% and are as efficient alone as associated with LLIN. According to the model of ITPS used the average amount of insecticide inside the house could be different but higher than LLIN alone or IRS only. The amount of insecticide per house increased with Durable Lining (almost 2 times more than classical Permanet 2.0) and the association Permanet2.0 + durable lining model Zero Fly increased by almost 5 times the amount of insecticide compared to full coverage in PermaNet2.0 alone. But it appeared that such increase in amount of insecticide was not followed by a spectacular impact in the density of main vectors caught by CDC Light Trap inside human houses.
According to these positive entomological results obtained by durable lining and their acceptability noticed in several places added to observation done in areas where vectors are resistant to pyrethroid it could be proposed an association of pyrethroid treated nets (with PBO or pyriproxyfen) and “other than pyrethroid (carbamates, organophosphate)” treated durable lining to deal with the worrying spreading of insecticide resistant vectors [59,60] and participated thus to the targeted malaria elimination.
The data of Balombo trial confirmed the assertion of Chandre et al (2010) that “ITPS has a potential role for community control of malaria” [20].
PC designed the protocol; participated to field surveys and specimen determination, analyzed data and drafted the manuscript; JCT did initial training, laboratory analysis and participated to field surveys; VF participated to field surveys; FF participated to the protocol and the follow up; GC participated in writing and check; FG participated and finalized data analyses.
The authors declare that they have no competing interests.
The study was done as part of and for the National Malaria Control Program.
We are grateful to the Angolese Sonamet© Company with its Medical Department which supported this trial in the framework of their Malaria Control Programme (MCP); and the British SubSea7© Company, which gave important support to these studies.
We personally thank Dr S. Manguin for her important entomological precision input.
We thank Mr Titelman who procured the material for vector control: long lasting nets and insecticide treated plastic sheetings.
We thank National and Provincial Public Health authorities, which allowed and supported the surveys and communities of these villages for their actual participation in the implementation of vector control operations.